Known limitations in MLOps Studio
Prerequisites
No. 1 Access to the MLOps Studio workspace and dashboard
Begin with access to the MLOps Studio site and namespace where the affected workload is running.
Open the workspace by following Access the MLOps Studio workspace.
Once inside, use Use the MLOps Studio dashboard to select the relevant site and namespace.
With the dashboard open in the correct namespace, you can identify the affected workload and compare its UI status with the command-line results.
No. 2 Namespace access and appropriate RBAC permissions
Investigating these limitations generally requires permission to list, get, and describe resources in the affected namespace, while some workarounds also require permission to create, patch, apply, or delete them.
Review how namespace membership and roles are assigned in Create and manage a MLOps Studio namespace.
Confirm that your role permits the intended operation; an MLOps Studio administrator must authorize or perform anything outside that scope.
No. 3 kubectl and namespace kubeconfig
Several limitations are visible only through Kubernetes events and resource conditions that the MLOps Studio UI does not display.
Prepare command-line access with Download and use kubeconfig for a MLOps Studio namespace.
Once KUBECONFIG is active and the namespace has been verified, kubectl is ready for the diagnostic commands in this article.
No. 4 Affected resource details
Before using a troubleshooting command, identify the exact pipeline run, pod, notebook, experiment, PVC, Job, or custom resource involved in the problem.
Record the namespace and relevant resource names so that they are ready to replace the command placeholders.
Katib Experiment creation fails when using the form-based CREATE workflow
When creating a Katib Experiment through the MLOps Studio Dashboard / Katib UI, the form-based CREATE button may fail for experiment configurations that define trialTemplate.trialParameters with reference fields.
Symptoms
The user fills in the experiment form with a valid configuration, including:
an objective,
an algorithm,
hyperparameters such as lr and momentum,
a trial template that uses trialParameters,
trialParameters[].reference values that point to the configured hyperparameter names.
After clicking CREATE, the Experiment is rejected by the Katib admission webhook with an error similar to:
500 validation error: name and reference must be specified
In older versions, this may have appeared as a less useful or silent error, for example:
[200] [object Object]
Cause
The issue is specific to the form-based CREATE workflow.
Although the trial template YAML may contain valid trialParameters entries with both name and reference, the form-based CREATE path rebuilds the trialParameters list from the hyperparameter fields entered in the form.
Those form fields contain the hyperparameter names, but they do not preserve the reference field. As a result, the UI overwrites the valid YAML-defined trialParameters and submits an Experiment where the reference values are missing.
Katib then rejects the request because each trial parameter must include both:
name: ...
reference: ...
Impact
Experiments that require trialTemplate.trialParameters[].reference cannot be reliably created through the form-based CREATE button workflow.
This commonly affects Experiments where the trial template references hyperparameters using placeholders such as:
${trialParameters.lr}
${trialParameters.momentum}
with trial parameters similar to:
trialParameters:
  - name: lr
    reference: lr
  - name: momentum
    reference: momentum
Suggested workaround
Use the Edit and submit YAML option in the Katib UI instead of the form-based CREATE button.
The Edit and submit YAML workflow preserves the trialParameters.reference fields correctly and allows the Experiment to be created successfully.
Before submitting, verify that the YAML contains valid trialParameters entries under spec.trialTemplate, for example:
spec:
  trialTemplate:
    trialParameters:
      - name: lr
        reference: lr
      - name: momentum
        reference: momentum
The reference value should match the corresponding hyperparameter name defined in the Experiment search space.
User guidance
Until the form-based CREATE workflow is fixed, users should avoid creating Katib Experiments with trialParameters.reference through that path.
Instead:
Configure or prepare the Experiment.
Open Edit and submit YAML.
Confirm that each trialParameters entry includes both name and reference.
Submit the Experiment from the YAML editor.
This avoids the UI code path that rewrites trialParameters and prevents the webhook validation error.
Katib successful run leaves no logs
Trial details, metrics, YAML, the live loss curve, and log streaming work while a Trial is running, but after completion the Logs tab may display [object Object] instead of historical logs or a clear status message.
Set .spec.trialTemplate.retain: true when post-run debugging is required: retain defaults to false, so Katib otherwise cleans up the completed Trial’s resources, including the worker resource used to locate its pod logs. Completed-Trial logs should remain available while the retained pod exists (or when a separate centralized logging system stores them); if they are unavailable, the UI should report that clearly rather than exposing a raw object. See the official Katib Trial template documentation.
Pipeline UI does not show useful error when pod cannot start
When a pipeline task references a missing secret, the wrong secret name, or a key that does not exist in the secret, its container cannot start. The Pipelines UI may show the task as pending or failed but provide no useful logs.
This is expected because container logs are created only after the container starts. Secret validation, environment-variable resolution, and volume mounting happen before startup, so these failures are reported as Kubernetes pod events instead of application logs.
Troubleshooting
Set the namespace and pod name used by the commands:
NAMESPACE="<pipeline-namespace>"
POD_NAME="<pipeline-task-pod>"
If the pod name is unknown, list the most recently created pods in the pipeline namespace:
kubectl get pods \
  --namespace "$NAMESPACE" \
  --sort-by=.metadata.creationTimestamp
Describe the affected pod:
kubectl describe pod "$POD_NAME" \
  --namespace "$NAMESPACE"
Review the Events section at the end of the output. Common messages include:
secret "<name>" not foundcouldn't find key <key> in Secret <namespace>/<name>CreateContainerConfigErrorMountVolume.SetUp failed
Query the pod events directly if the relevant message is difficult to find in the description:
kubectl get events \
  --namespace "$NAMESPACE" \
  --field-selector "involvedObject.name=$POD_NAME" \
  --sort-by=.lastTimestamp
You can also inspect recent namespace events when the pod name is unavailable or the pod has already been removed:
kubectl get events \
  --namespace "$NAMESPACE" \
  --sort-by=.lastTimestamp
Verify the secret
After identifying the referenced secret and key from the event, verify that the secret exists in the same namespace as the pipeline task:
SECRET_NAME="<secret-name>"

kubectl get secret "$SECRET_NAME" \
  --namespace "$NAMESPACE"
kubectl describe secret "$SECRET_NAME" \
  --namespace "$NAMESPACE"
kubectl describe secret shows the available key names and value sizes without printing the secret values. Confirm that:
The secret exists in the pipeline namespace.
The pipeline references the exact secret name.
Every referenced key exists with the expected spelling and capitalization.
The pipeline’s service account is allowed to use the secret when platform policy restricts secret access.
Do not print, decode, or include secret values in troubleshooting output or support tickets.
Apply the fix
Correct the secret name or key in the pipeline definition, or create the missing secret in the correct namespace. Then submit a new pipeline run. An existing pod with an invalid secret reference generally cannot be repaired in place.
If the Pipelines UI has no logs and the task container never started, use kubectl describe pod and Kubernetes events first. Retrying the pipeline without correcting the secret reference will produce the same failure.
MLOps Studio Pipelines Stale Image Execution via Node Caching
When executing MLOps Studio Pipelines, the pipeline may successfully pull an image from Harbor and complete its run, but secretly utilize an outdated, locally cached version of the container image. This occurs when developers push updated code to an existing mutable tag (e.g., :dev, :v1, or a branch name), but the Kubernetes node executing the pipeline pod already has a previous version of that tag cached locally.
This limitation stems from how Kubernetes handles the container imagePullPolicy by default when a policy is not explicitly defined in the KFP component:
:latest tags: Kubernetes defaults to imagePullPolicy: Always. It will always check Harbor for a new digest.
Specific tags (e.g., :v1.0) or no tags: Kubernetes defaults to imagePullPolicy: IfNotPresent.
When IfNotPresent is active, the Kubelet checks the node’s local cache first. If an image with the requested name and tag already exists on that specific node, Kubernetes bypasses Harbor entirely and spins up the container using the cached layers. It does not verify if the image in Harbor has been updated.
Workarounds and Best Practices
To resolve this limitation, users must adopt one of the following approaches:
Solution A: Enforce imagePullPolicy: Always (Immediate Fix)
You can explicitly override the Kubernetes default behavior within the MLOps Studio Pipeline definition. This forces the Kubelet to contact Harbor and compare image digests before every execution, ensuring the newest version is pulled.
Example using KFP Python SDK (v2):
from kfp import dsl

@dsl.component
def my_ml_component():
    pass

@dsl.pipeline(name='my-pipeline')
def my_pipeline():
    task = my_ml_component()
    # Force Kubernetes to check Harbor for updates
    task.container.set_image_pull_policy('Always')
Solution B: Adopt Immutable Image Tagging (Long-Term Best Practice)
The industry standard to prevent caching collisions is to stop reusing mutable tags. Every push to Harbor should generate a completely unique tag. Because the tag is entirely new, Kubernetes will never find it in the IfNotPresent cache and will securely pull the new image.
Git Commit SHA: Tag images with the short SHA (e.g., my-image:a1b2c3d).
CI/CD Pipeline ID: Use the automated build number (e.g., my-image:build-402).
Verification via CLI
If you suspect a pipeline has executed a stale image, do not rely on the MLOps Studio UI. You must check the exact image digest running in the pod using kubectl:
Identify the pod name in your MLOps Studio namespace.
Describe the pod and look for the specific Image ID digest:
kubectl describe pod <pod-name> -n <your-kubeflow-namespace> | grep -i "Image ID"
Compare the resulting SHA256 digest against the latest digest shown in Harbor. If the digests do not match, the node used a stale local cache.
MLOps Studio Pipelines Unintended Step Skips via Compile-Time Execution Caching
When executing a pipeline multiple times with the same parameters, subsequent runs may complete almost instantly without actually executing the code. Instead of spinning up new pods, MLOps Studio reuses the outputs from a previous successful run.
While caching saves compute resources, the limitation lies in how it is controlled: caching behavior is hardcoded at compile time, not run time. In the run graph, a step whose results were retrieved from the cache is marked with a green “arrow from cloud” icon. Users should look for this icon instead of relying only on the step’s successful status or green coloring, which can otherwise be mistaken for a fresh execution. Users often assume they are validating logic or benchmarking performance, but are actually just viewing recycled outputs.
For the authoritative description of caching behavior and configuration options, see the official Kubeflow Pipelines caching documentation.
MLOps Studio Pipelines implements execution caching by calculating a hash based on a component’s inputs, container image, and parameters. If the orchestration engine finds an exact hash match from a previous successful execution, it skips pod creation entirely and passes the old output artifacts forward.
Because this caching state is baked into the compiled pipeline definition (YAML/JSON), users cannot easily toggle it off from the MLOps Studio Dashboard when triggering a new run. If an external dependency changes (like data residing in an external database or an API response) but the KFP component parameters remain identical, the hash does not change, and the pipeline will silently serve stale data.
Workarounds and Best Practices
To ensure pipelines execute fresh code and pull live data, developers must alter the pipeline definition before compiling.
Solution A: Disable Caching at Compile Time (Immediate Fix)
You can explicitly disable caching at the pipeline or component level using the KFP SDK. This forces the orchestration engine to execute the step regardless of previous run history. You must recompile and upload the new pipeline version after making this change.
Example using KFP Python SDK (v2):
from kfp import dsl

@dsl.component
def my_ml_component():
    pass

@dsl.pipeline(name='my-pipeline')
def my_pipeline():
    task = my_ml_component()
    # Force MLOps Studio to execute this step every time
    task.set_caching_options(enable_caching=False)
Solution B: Implement Cache-Busting Parameters (Workflow Strategy)
If you want to leave caching enabled globally but force specific runs to execute fresh, inject a unique, changing variable (like a timestamp, Git commit hash, or unique run ID) into the component as an input parameter. Because the input parameter changes every time, the resulting hash will be unique, naturally bypassing the cache mechanism.
ReadWriteOnce (RWO) Volume Attachment Conflicts and UI Obfuscation
When utilizing Persistent Volume Claims (PVCs) configured with the ReadWriteOnce (RWO) access mode, users frequently encounter silent deployment hangs. This limitation manifests in two primary ways within the MLOps Studio ecosystem:
Hanging Pipeline Steps: A pipeline step that attempts to mount a ReadWriteOnce PVC currently attached to another workload (such as an active notebook or another pipeline run) will remain stuck in a pending state indefinitely. The Pipeline UI does not surface the reason for the hang.
Deceptive Notebook Creation: The MLOps Studio Notebooks UI allows users to successfully provision a new notebook using an RWO PVC that is already attached to an existing workload. The new notebook will fail to start, but the main UI does not proactively warn the user or block the creation.
In both scenarios, the core expectation – that users should be able to understand workload startup failures directly from the primary UI without manual Kubernetes inspection – is not met.
This issue is caused by a disconnect between Kubernetes storage primitives and the MLOps Studio frontend layer:
Kubernetes RWO Constraints: By definition, a ReadWriteOnce volume can only be mounted as read-write by a single node at a time. If a new pod (a pipeline step or a notebook server) requests an RWO PVC that is already mounted elsewhere, the Kubernetes scheduler cannot fulfill the request. The new pod is forced into a perpetual Pending state, and the Kubelet emits a FailedAttachVolume or Multi-Attach warning event.
MLOps Studio UI Limitations: The main MLOps Studio dashboards (both Pipelines and Notebooks) are optimized to track high-level pod execution states (e.g., Running, Succeeded, Failed). They do not natively extract, parse, and surface underlying Kubernetes scheduling events or volume attachment constraints on the primary views. Therefore, the UI simply waits for a pod to “start,” which never happens.
Workarounds and Best Practices
Users must treat RWO volumes as strictly ephemeral or fully isolated:
Notebooks: Shut down (cull) any idle notebooks before triggering pipelines that require access to the same PVC.
Pipelines: Dynamically provision a new, temporary PVC for each pipeline run using VolumeOp, rather than hardcoding static PVC names into the pipeline components.
When a pipeline step or notebook is inexplicably hanging, users must bypass the MLOps Studio UI and verify the storage attachment status directly via kubectl:
Identify the Pending pod in the user’s namespace.
Inspect the pod’s recent events for multi-attach errors:
kubectl describe pod <pending-pod-name> -n <your-kubeflow-namespace>
Look at the Events: section at the bottom of the output. A volume conflict is confirmed if you see warnings similar to:
Warning FailedAttachVolume Multi-Attach error for volume "pvc-xyz" Volume is already exclusively attached to one node and can't be attached to another.
Python packages disappear in Jupyter Notebooks
In MLOps Studio, a Jupyter Notebook server is a Docker container attached to a Persistent Volume (PV).
The Ephemeral Container: System directories like /opt/conda or /usr/local are part of the base container image. If the notebook is stopped and restarted, a fresh container is pulled, and any changes made to these root directories are permanently wiped.
The Persistent Volume: Your personal workspace—typically mounted at /home/jovyan—is backed by the Persistent Volume. Anything saved inside this specific directory survives a restart.
Because default pip install or conda install commands attempt to write to the global, ephemeral system paths, those packages are deleted upon restart. To fix this, you must instruct the package manager to install dependencies into your persistent home directory.
Here are the two best ways to do this, along with how to verify the fix.
Method 1: The –user Flag (Easiest for Pip)
If you are just installing a few Python packages using pip, the simplest solution is to use the –user flag. This forces pip to install the package into /home/jovyan/.local/lib/, which is located on your persistent volume.
Step-by-Step:
Open your MLOps Studio Jupyter Notebook.
Open a new Terminal or run a command from a notebook cell.
Add –user to your pip install command:
pip install --user <package_name>
Note: If you are running this from a notebook cell, for example !pip install –user <package_name>, you must Restart the Kernel after installation for the notebook to recognize the new path.
Method 2: Persistent Conda Environments (Best for Complex Projects)
If you need a completely separate environment with specific Python versions or complex dependencies, you can create a custom Conda environment directly inside your persistent volume.
Step-by-Step:
Open a Terminal in your Jupyter environment.
Create a new Conda environment, explicitly defining the path inside your home directory using the –prefix flag:
conda create --prefix /home/jovyan/my-persistent-env python=3.10
Activate the new environment:
conda activate /home/jovyan/my-persistent-env
Install your required packages, because the environment is on the persistent volume, standard pip install or conda install will now persist:
pip install <package_name>
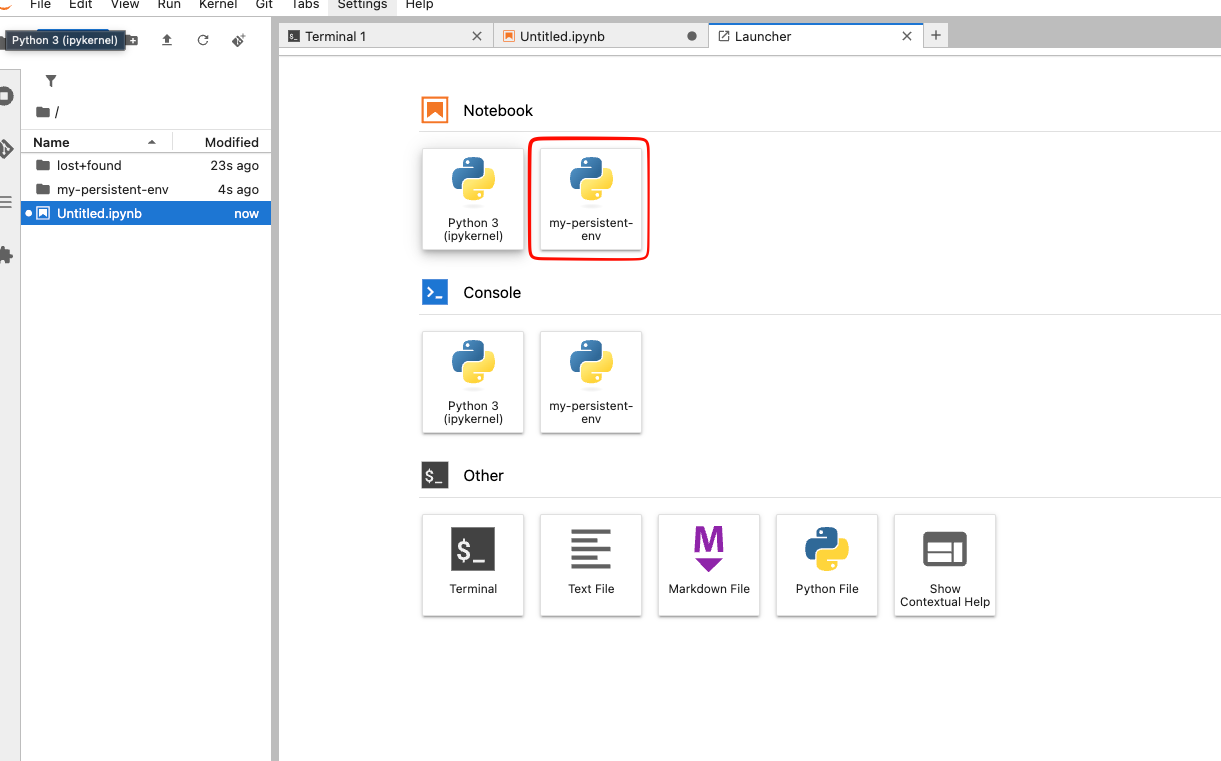
Make it visible to Jupyter: Register this new environment as a Jupyter kernel so you can select it when creating new notebooks:
pip install ipykernel
python -m ipykernel install --user --name=my-persistent-env
After installing your kernel you can use during creating new files in your notebook.
How to Verify Your Installation is Persistent
Before shutting down your server, you can easily verify whether a package will survive the restart by checking its installation path.
In the terminal or a notebook cell, run:
pip show <package_name>
Look at the Location field in the output.
Persistent (Will Survive): If the path starts with /home/jovyan/… or your specific home directory, you are safe.
Ephemeral (Will Delete): If the path starts with /opt/conda/… or /usr/local/…, the package will be lost on restart.
Tip for reproducibility: It is always a best practice to keep a requirements.txt file in your persistent workspace. If your environment ever becomes corrupted, you can quickly rebuild it by running pip install --user -r requirements.txt.
User with viewer permissions can create and remove Katib experiments.
This is a known upstream Kubeflow bug. Katib is not properly respecting the permissions which leads to a situation in which viewer user can modify experiments. It is tracked in upstream https://github.com/kubeflow/katib/issues/1547
Cause
Katib is not properly respecting SubjectAccessReviews and always uses Katib UI service account.
Workaround
There is no workaround available. If some experiments should be protected from other people a separate namespace should be created with limited access.
Percona pxc-restore CR Stuck in “Restoring” State Post-PITR
Symptom Description
After initiating a Point-in-Time Recovery (PITR) from S3 using the Percona XtraDB Cluster Operator, the PerconaXtraDBClusterRestore (pxc-restore) Custom Resource remains permanently stuck in the Restoring state.
Despite the hung status on the CR, the actual database recovery is successful. Verification steps will show:
The underlying Kubernetes restore job (
restore-job-restore-pitr-...) is marked asCompleted.XtraBackup logs output
completed OK!.The Percona cluster pods (
mysql-pxc-0,1,2) restart successfully and reach a3/3 Runningstate.The database is fully functional and accepting connections.
Root Cause
This is a known control-plane reconciliation bug within the Percona Operator (https://github.com/percona/percona-xtradb-cluster-operator/issues/2348).
The Operator relies on an internal state machine loop to watch the
restore-job. When the job completes and the Percona pods restart to mount
the restored data, the Operator is supposed to execute post-restore cleanup
tasks (such as recreating the binlog collector) and then update the
pxc-restore CR status to Succeeded.
However, the Operator frequently desyncs during this transition. It may time
out waiting for a specific pod readiness signal or miss the job completion
event entirely. Once the Operator drops the reconciliation loop for that
specific event, it stops evaluating the CR, abandoning it in the Restoring
state.
Impact Analysis
Severity: Low (Control-Plane Only) This bug strictly affects cluster metadata. Database integrity and data-plane operations are entirely unaffected. The data extraction from S3 and the binlog replay are handled securely by the underlying Kubernetes Job, which completes independently of the Operator’s status update bug.
Workaround
Because the cluster is fully restored and functional, the stuck
pxc-restore CR is effectively dead metadata. The workaround is to manually
delete the resource to clean up the cluster state.
Step 1: Verify the Restore is Complete
Before deleting anything, explicitly confirm that the restore job has successfully finished and the pods are healthy:
kubectl get jobs -n <namespace> | grep restore-job
kubectl get pods -n <namespace> | grep pxc
Step 2: Delete the pxc-restore CR
Issue a standard delete command against the stuck resource:
kubectl delete pxc-restore <restore-cr-name> -n <namespace>
Note: Deleting this CR will not delete your Percona cluster or drop any Persistent Volumes. It only removes the completed operation request.
sidecar.istio.io/inject in KFP 2.5.0 Pipelines
In pipelines compiled and executed on KFP 2.5.0, you must add the following
annotation: sidecar.istio.io/inject: "true" to every pipeline step if any
of the steps require communication via Istio (e.g., with the Model Registry).
In this version of KFP, tasks may share a single, common template. This template
can be generated based on the alphabetically first task. If this first task
lacks the sidecar.istio.io/inject: "true" annotation, subsequent tasks may
also run without the correct sidecar, even if the annotation was explicitly
added to them.
In practice, this can lead to errors such as RBAC: access denied when
communicating with the Model Registry.
Example:
from kfp import kubernetes

def add_istio_sidecar(task):
    kubernetes.add_pod_annotation(
        task,
        annotation_key="sidecar.istio.io/inject",
        annotation_value="true",
    )
    return task
Next, you need to call this function for every single task:
add_istio_sidecar(name_task)
add_istio_sidecar(register_task)
add_istio_sidecar(verify_task)
Rule: if a pipeline uses Model Registry or another service that requires an
Istio sidecar, add sidecar.istio.io/inject: "true" to all pipeline steps,
including technical steps that do not call that service directly.
In newer KFP versions, handling of templates and per-task annotations has been improved, but in the current version the workaround above should be used.
Katib metrics collector: StdOut/File unreliable
In the current Katib version, StdOut and File metrics collectors may be
unreliable.
Observed behavior:
Katib Experiment/Trial starts correctly.
The training container finishes successfully.
The metric is printed to stdout or written to file.
The
metrics-logger-and-collectorsidecar may stay inRunning.As a result, Trial/Experiment may not finish correctly.
This should not be treated as a GPU, CUDA, NVIDIA device plugin, PyTorch, Spark, or Kueue issue if the same behavior appears on a minimal CPU-only Katib test.
Recommended workaround:
Use the Push collector instead of StdOut or File.
Example:
metricsCollectorSpec:
  collector:
    kind: Push
For Python training code, report metrics with:
import kubeflow.katib as katib
katib.report_metrics({"accuracy": acc})
How to test:
kubectl -n test apply -f katib-push.yaml
kubectl -n test get experiment,trials,pods -w
kubectl -n test describe experiment gpu-hpt-kueue-pk-debug
Expected result:
Experiment finishes correctly.
Trials do not stay stuck in
Running.Training pods finish as
Completed.Metrics are visible in Katib.
No
metrics-logger-and-collectorsidecar remains running forever.
Conclusion: for reliable Katib tests in this version, use Push. StdOut
and File should be treated as unreliable collector modes.