Status page for Destination Earth Data Lake services
Destination Earth Data Lake provides real-time status updates on its services. This guide details how to select the proper cloud, the services that you can observe, how to select the types of incident to watch and more.
What we are going to cover
Links for the DEDL status pages
For current availability status, visit the status page for DEDL sites.
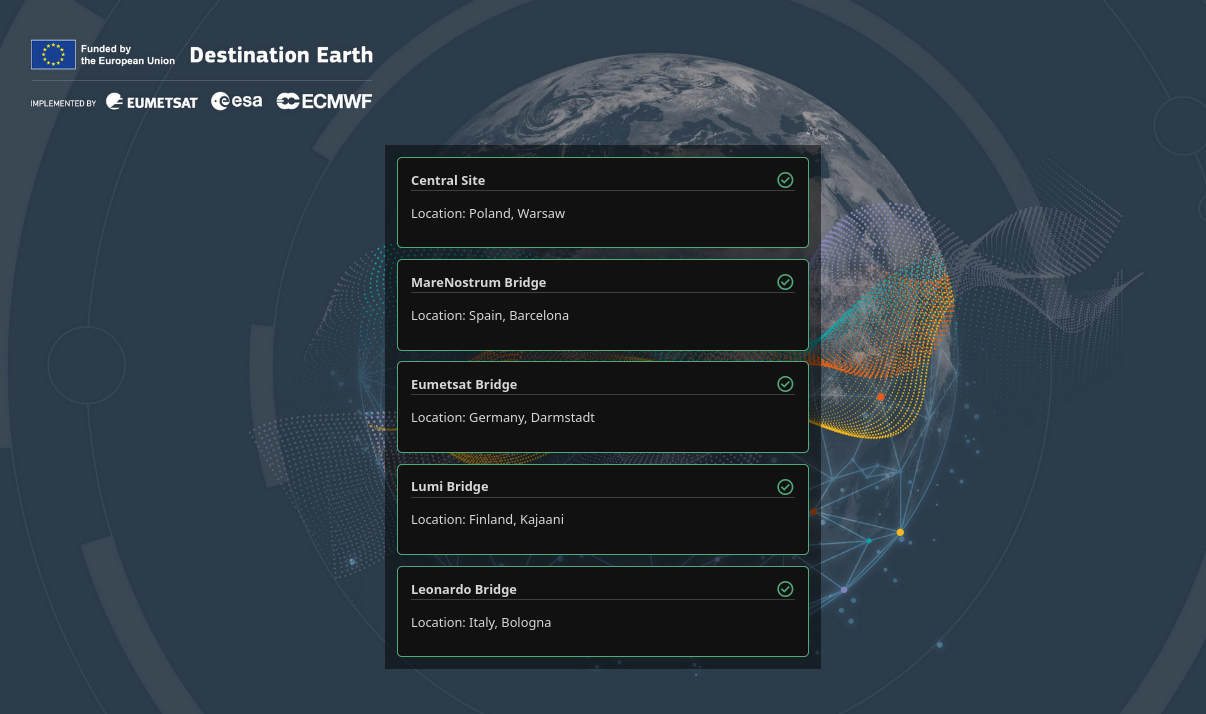
Main menu for DEDL live status page
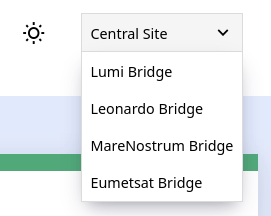
Next, select the cloud for which you want to observe the status of available services. The services that the CENTRAL is offering are mostly the same but not quite identical to the services the clouds have: MareNostrum Bridge, Eumetsat Bridge, Lumi Bridge, Leonardo Bridge.
Understanding the status page layout
Let us assume you have chosen to view the status page for CENTRAL. There are four parts of the layout, as denoted by rectangles of various colors in the following image:
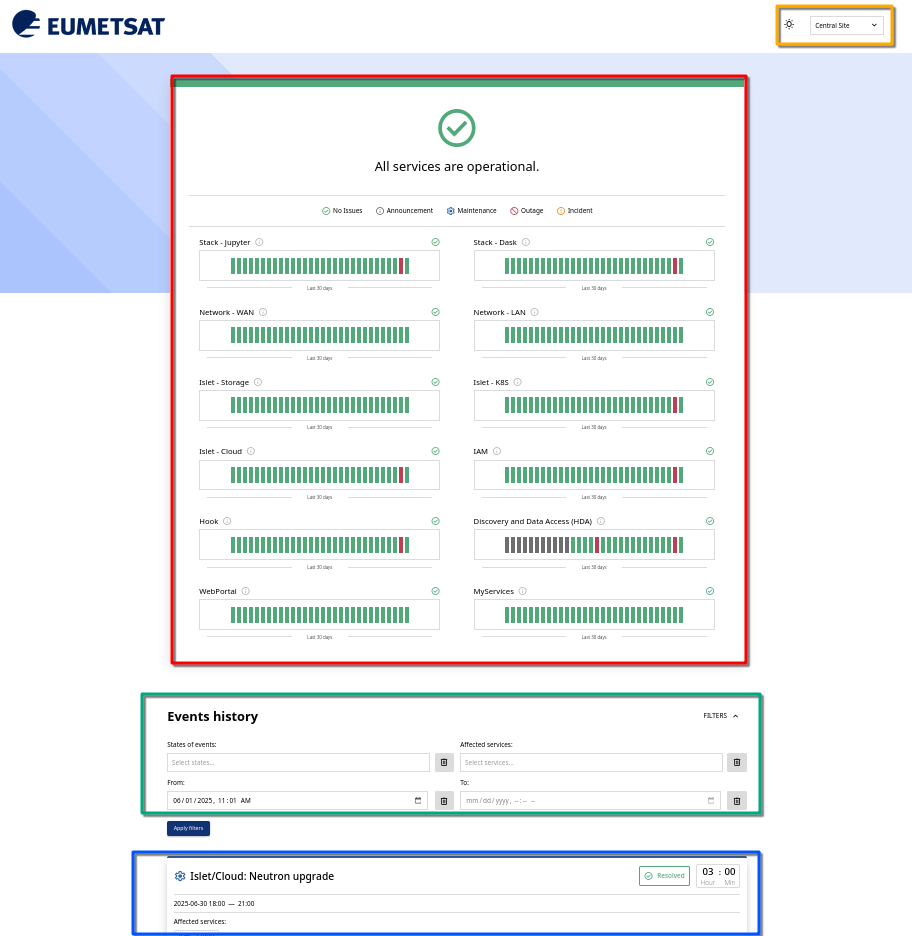
Elements of status page GUI
- Menu options (orange color)
Icon
 to switch day and night view
Menu to switch to the status page of particular cloud
- The central part (red)
Shows tracking the status of each service for the past 30 days. Each day’s status is represented by a vertical bar, allowing you to see whether the service experienced any disruptions, maintenance periods, or outages during that time.
The exact contents of this area depends on the services available in the particular DataBridge site (Cloud Site).
- Events history (green)
The form to set up filters for reports.
- Reports (blue)
Showing a list of filtered reports.
The services tracked
Some services, such as IAM, WebPortal, and MyServices, are only tracked on the Central Site status page.
Specific to bridges Lumi, Leonardo and MareNostrum is service Network - Bridge to HPC; it shows the status of connection to the connected supercomputer/HPC.
SERVICE |
CENTRAL |
LUMI |
LEONARDO |
MARENOSTRUM |
EUMETSAT |
|---|---|---|---|---|---|
Stack - Jupyter |
YES |
YES |
YES |
YES |
YES |
Stack - Dask |
YES |
YES |
YES |
YES |
YES |
Network - WAN |
YES |
YES |
YES |
YES |
YES |
Network - LAN |
YES |
YES |
YES |
YES |
YES |
Islet - Storage |
YES |
YES |
YES |
YES |
YES |
Islet - K8s |
YES |
YES |
YES |
YES |
YES |
Islet - Cloud |
YES |
YES |
YES |
YES |
YES |
IAM |
YES |
||||
Hook |
YES |
YES |
YES |
YES |
YES |
Discovery and Data Access (HDA) |
YES |
YES |
YES |
YES |
YES |
WebPortal |
YES |
||||
MyServices |
YES |
||||
Network - Bridge to HPC |
YES |
YES |
YES |
Service availability states
The status page displays the current state of services. Each service is tracked with five possible states, which are indicated using color-coded bars:

To each status there is a specific color attached:
Status |
Symbol |
Color |
Bar |
|---|---|---|---|
No Issues |
|
Green |

|
Announcement |
|
Gray |

|
Maintenance |
|
Blue |

|
Outage |
|
Red |

|
Incident |

|
Orange |

|
If you hover over a bar, you will see more information about the specific event. This could include multiple events occurring on the same day, as shown in the examples below:
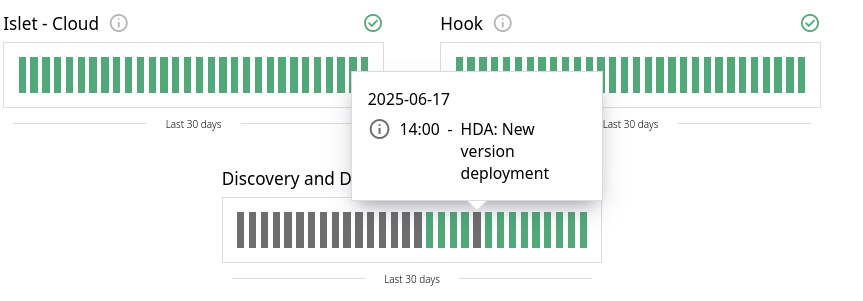
Example of a single event on a specific day.
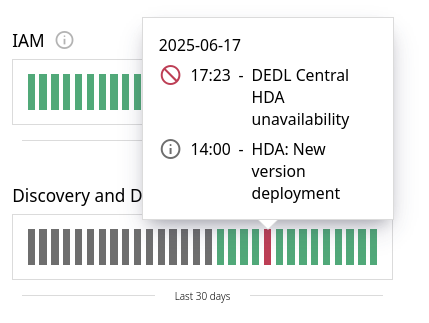
Example of multiple events occurring on the same day.
No Issues
The service is running smoothly with no reported issues. All systems are operational, and there are no disruptions or outages at this time.
EXPECTED BEHAVIOUR: The service is functioning as usual.
Announcement
An important update or announcement is currently being shared.
EXPECTED BEHAVIOUR: Stay tuned for any notifications or updates regarding service changes, new features, or upcoming events. No service disruptions are expected.
Maintenance
Scheduled maintenance is being performed to ensure the continued reliability and performance of the service. During this time, certain features or components may be temporarily unavailable. We appreciate your patience and understanding as we work to improve the service.
EXPECTED BEHAVIOUR: Expect a notification or email message stating that the problem has been overcome. If critical services are affected, consider using backup systems while awaiting updates and notifications.
Outage
An unexpected outage is affecting the service, and users may experience disruptions or complete unavailability. Our team is actively working to restore service as quickly as possible. We apologize for any inconvenience caused and will provide updates as more information becomes available.
EXPECTED BEHAVIOUR: Expect a notification or email message stating that the problem has been overcome. Contact support if the outage affects critical services.
Incident
An ongoing incident is impacting the service, and our team is currently investigating the issue. While the service may be partially affected, we are working towards resolving the incident promptly. Please check for further updates as we work to restore normal operation.
EXPECTED BEHAVIOUR: Expect a notification or email message stating that the problem has been overcome.
Understanding the Service Status Over Time
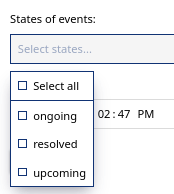
To filter events, select a time period or event state. Use filter options to view only ongoing, resolved, or upcoming events.
State |
Symbol |
|---|---|
ongoing |

|
resolved |

|
upcoming |

|
For instance, you can apply filters to view only ongoing events or resolved issues in the past week, helping you analyze the service’s reliability over time. The status page also provides a comprehensive overview, allowing you to track patterns and plan accordingly.
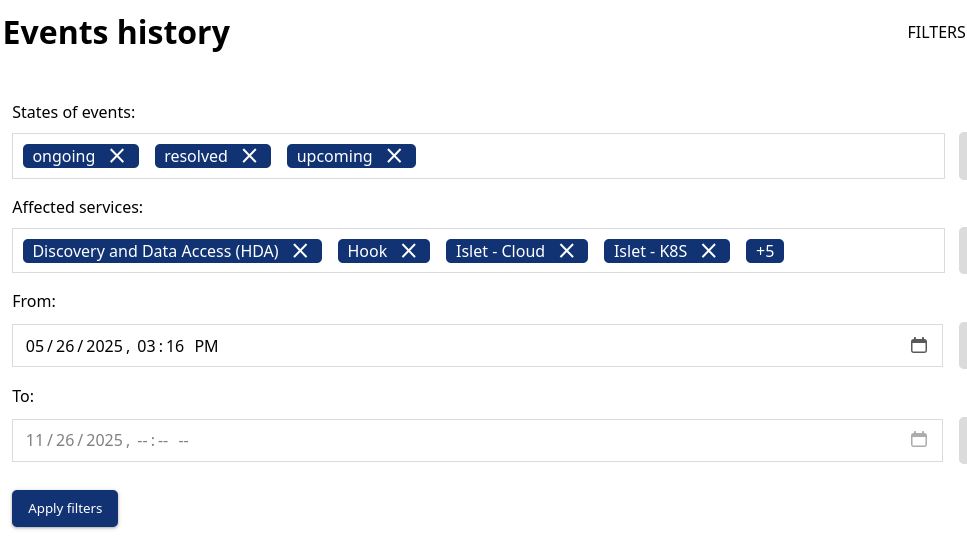
Events history
In this form, you combine states of events with the affected services over a designated period of time.
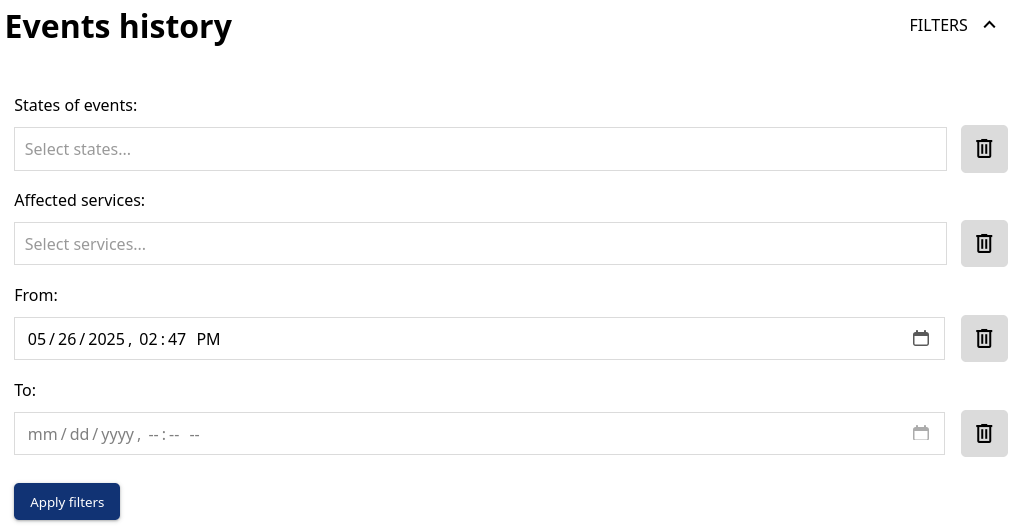
Set up the parameters, the time period and click on Apply filters.
States of events
Ongoing
An event with the ‘Ongoing’ state show events that are currently in progress. These types of events are monitored closely and resolved as soon as possible.
In the image below we see an example of a previous ongoing event.
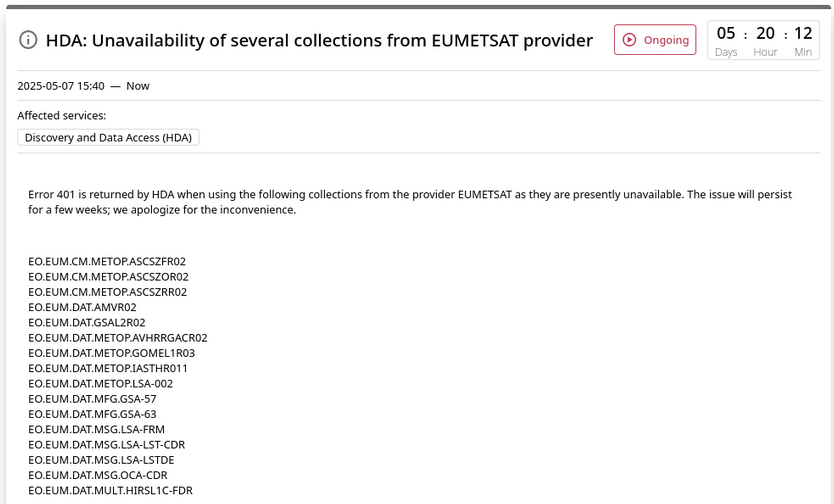
When a set of data collections becomes unavailable for a period, attempting to access them will result in a 401 error.
We would provide an update once these collections are available again.
Any future collections that become temporarily unavailable will be listed in this section, along with the expected resolution date.
Resolved
Success, all issues have been addressed, and any necessary actions have been taken. A typical resolved event looks like this:
Check the service now to ensure it’s back online
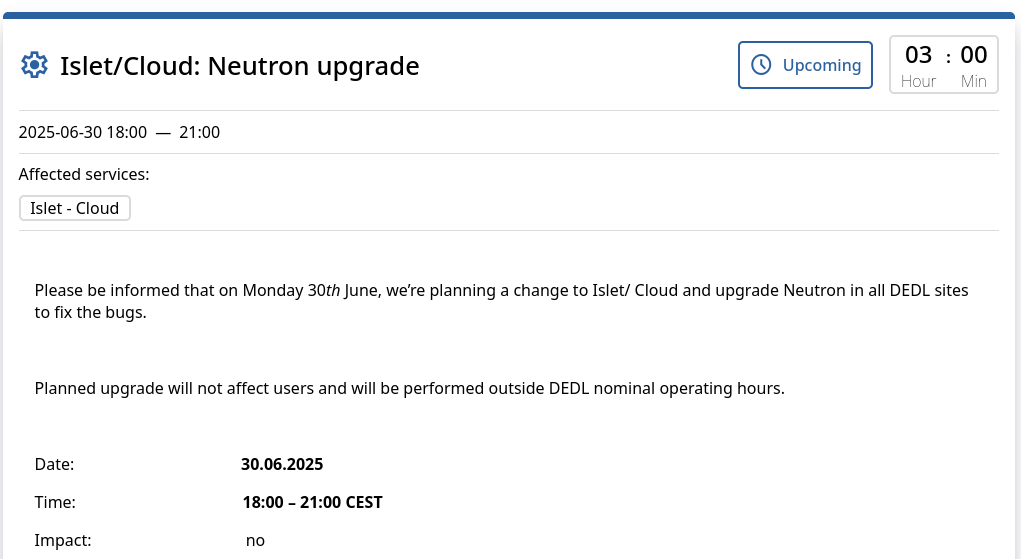
Upcoming
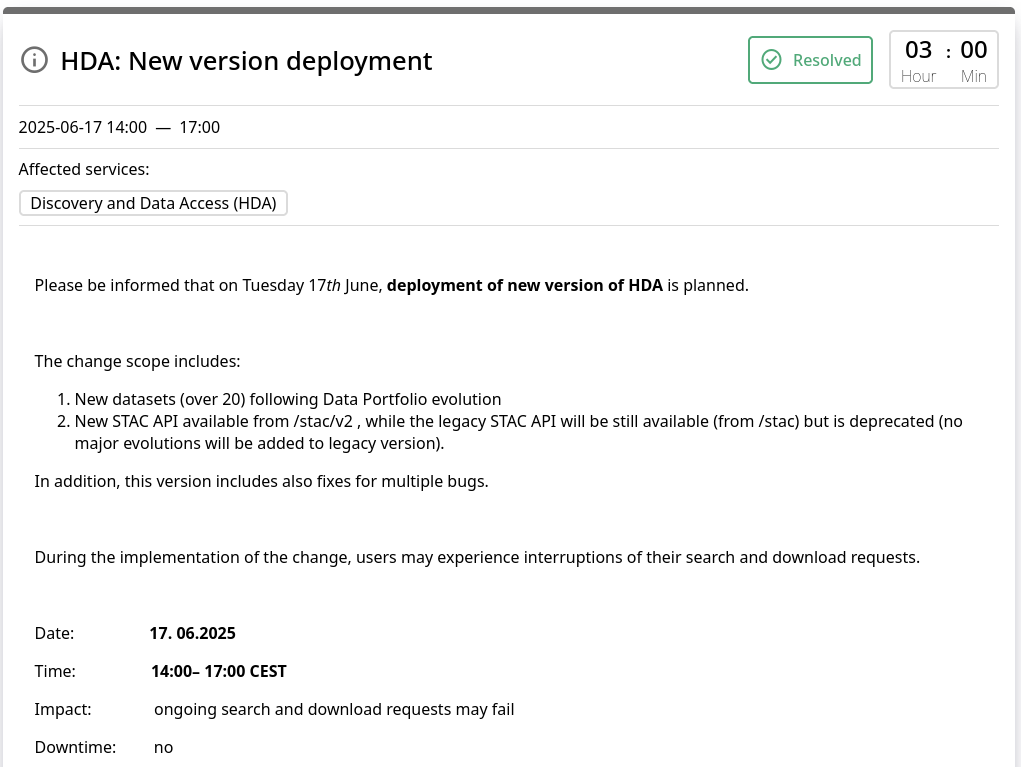
These events are scheduled to take place in the future. Stay tuned for further details, including time, location, and additional information. A typical upcoming event looks like this:
Example of a resolved incident
Note the color at the top of the form, as it corresponds to the current service state. Therefore, gray is for an announcement, but red would be for an outage, as in the following screenshot:
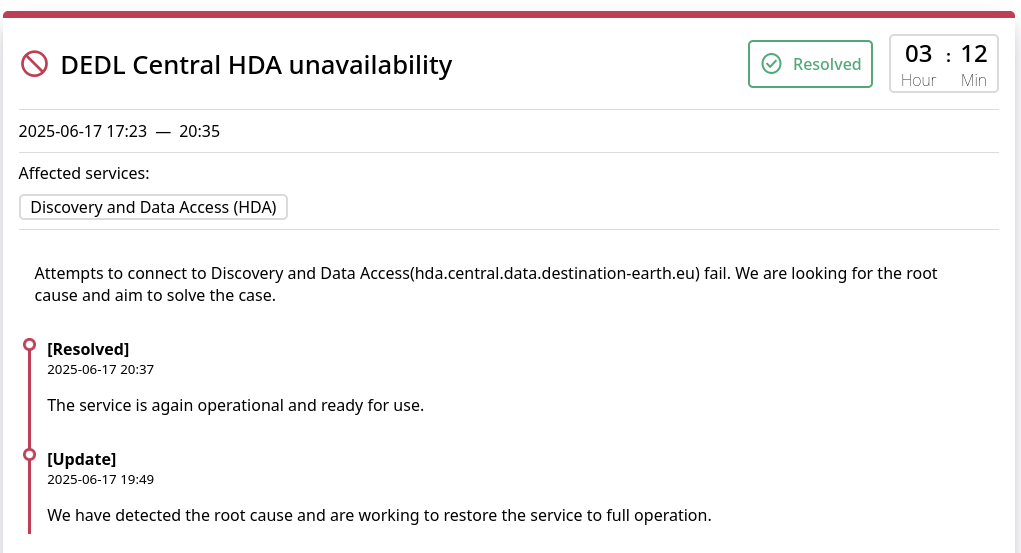
The interpretation is that on the 17th of June 2025 DEDL service Central HDA was unavailable, that was classified as an incident but has been resolved.
Option Select All
Selecting all events will provide a comprehensive overview of the events in the chosen time period. From there, you usually try to pin down the period when problems occurred in the past, or, in case of announcements, when will a new event occur. You can select a combination of states of events and the statuses of each service.
Services affected
The list of affected services will differ from cloud to cloud, as stated in the Available services per cloud table from the first part of the article.
Check on a service to view detailed status history and event updates.
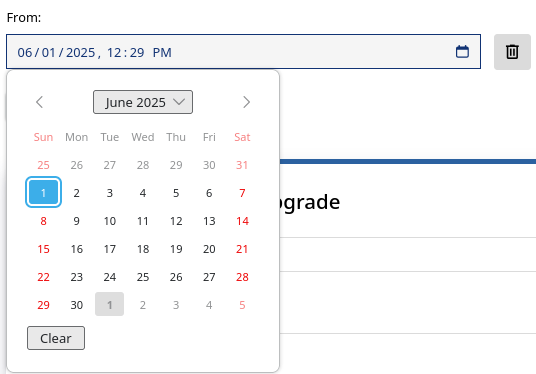
Define time period
The default value for time period when filtering is 30 days.
Use the From and To fields to select the desired time period. Selecting a future date in the To field along with an upcoming event state will alert you to potential future issues.
Apply filters
Here is an example with all states and affected services selected:
What To Do Next
In case of outages and incidents, please contact Support or open a support ticket for immediate assistance.
For critical services, ensure backup systems are in place to minimize disruptions.