The Common Data Model
Note
Download the executable 03_common_data_model.ipynb to run this tutorial in JupyterLab.
Every DEFAIR reader returns the same kind of object: an xarray dataset carrying the product’s own variables, and beside it a Common Data Model that says how that product is laid out in space and time. The transformations read the model rather than the variable names, which is why one spatial filter works on a geostationary disc, a polar swath and a sinusoidal grid alike.
This tutorial builds a small reader for a fictional product, watches the model follow the data through two transformations, then does the same thing to a real MSG SEVIRI granule.
Before running this notebook, complete the shared setup in Tutorials.
Prerequisites
No. 1 Input data
The notebook reads these products from the public demo bucket of the DestinE Data Lake, without an account or credentials:
One MSG SEVIRI native granule
To use your own files instead, change the path in S3_URI and follow
Prepare data access for DEFAIR. It explains
how to read them from your own object store, from a local disk or
through HDA.
Set up the notebook
import numpy as np
import xarray as xr
import dask.array as da

from defair_data.cdm import build_swath_cdm
from defair_data.core import Dataset
from defair_data.dask_manager import close_dask_client
from defair.plugin_manager import load_transformation
from defair.logging import setup_logging

setup_logging(log_level="WARNING")
What a new reader has to fill in
The reader below is complete. Everything except _build_cdm is
ordinary plugin scaffolding: the extensions it claims, its priority, and
a read that returns data. The model itself is one call:
build_swath_cdm for a swath, build_point_cdm for point data.
Gridded, geostationary and projected products declare their model
directly instead, with build_geostationary_params filling in the
geostationary block of a gridded one.
Write a reader plugin is the full reference for writing one.
from defair_data.data_reader_plugin import DataReaderPlugin


class MySwathReader(DataReaderPlugin):
    """A reader for a fictional swath product."""

    # --- standard plugin scaffolding (file routing, priority) -----------
    SUPPORTED_EXTENSIONS = [".nc"]
    PRIORITY = 50

    def read(self, path, source=None, source_kwargs=None):
        # In a real reader: open the file via self.open_file(path, ...).
        # Here: synthetic stand-in so the demo is self-contained.
        ny, nx = 24, 40
        raw = xr.Dataset(
            data_vars={"radiance": (("rows", "columns"), da.random.uniform(0, 200, (ny, nx), chunks=12))},
            coords={
                "latitude":  (("rows", "columns"), 35 + np.linspace(0, 30, ny)[:, None] + np.zeros((1, nx))),
                "longitude": (("rows", "columns"), -10 + np.linspace(0, 50, nx)[None, :] + np.zeros((ny, 1))),
            },
        )
        return Dataset(raw, cdm=self._build_cdm(raw))

    # --- the only data-model code in the entire reader -------------------
    def _build_cdm(self, ds):
        return build_swath_cdm(
            reader="my_swath", product_family="my_swath", ds=ds, time_representation="sensing_start"
        )


# Entry-point registration lives in your reader package's pyproject.toml:
#
#     [project.entry-points."defair_data.readers"]
#     my_swath = "my_pkg.readers.my_swath:MySwathReader"
#
# After that, Dataset.from_source("...nc") discovers MySwathReader automatically
# via file extension + PRIORITY.

ds = MySwathReader().read("synthetic://my_swath")
g  = ds.cdm.spatial_groups[0]
print("dispatch_key :", g.dispatch_key)
print("variables    :", g.variables)
print("topology     :", g.topology)
dispatch_key : ('curvilinear', 'swath_like')
variables    : ('radiance',)
topology     : swath_like
The model survives the pipeline
Read the fictional product, then filter it and reproject it. The dispatch key printed at each step is how a transformation decides which code path a dataset needs.
spatial_filter, reprojection = load_transformation("spatial_filter"), load_transformation("reprojection")

ds_eu  = spatial_filter.transform(ds, lat_min=40, lat_max=60, lon_min=0, lon_max=20)
ds_geo = reprojection.transform(ds_eu, target="EPSG:4326", resolution=0.5, resampling="bilinear")

print("input    :", dict(ds.data.sizes),     "   key:", ds.cdm.spatial_groups[0].dispatch_key)
print("filtered :", dict(ds_eu.data.sizes),  "   key:", ds_eu.cdm.spatial_groups[0].dispatch_key)
print("reproject:", dict(ds_geo.data.sizes), "  key:", ds_geo.cdm.spatial_groups[0].dispatch_key)
input    : {'rows': 24, 'columns': 40}    key: ('curvilinear', 'swath_like')
filtered : {'rows': 16, 'columns': 16}    key: ('curvilinear', 'swath_like')
reproject: {'lon': 40, 'lat': 40}   key: ('gridded', 'geographic')
Why the model is worth having
The first comment below is the production code a transformation uses to answer “where does latitude live for this dataset”, next to what the same plugin would need without a model. That difference is the argument for the Common Data Model in one screen. The second is the reprojection precheck, abridged to the loop that dispatches it.
# spatial_filter — "where does latitude live for this CDM?" production code:
#
#     @staticmethod
#     def _cdm_lat_name(spatial: SpatialModel) -> str | None:
#         if isinstance(spatial, CurvilinearModel | PointModel):
#             return spatial.latitude or None
#         if isinstance(spatial, GriddedModel):
#             if spatial.geostationary is not None and spatial.geostationary.latitude:
#                 return spatial.geostationary.latitude
#             if spatial.subkind == "geographic":
#                 return spatial.y_coord or None
#         return None
#
# That covers every model class, on every product. Without the model the plugin would need:
#   - probe coord names: 'lat', 'latitude', 'nav_lat', 'Latitude', 'LAT', ...
#   - fall back to CF standard_name='latitude' (not always set)
#   - distinguish 1-D axis vs 2-D nav array by shape
#   - special-case geostationary (y axis is metres, not degrees)
#   - special-case projected (no 1-D lat at all: sinusoidal, UTM, Lambert)
#   - eager .min()/.max() to detect lon-180 vs lon-360 — ~190 MB compute
#     per granule on a 4000x3000 swath lon array
#
#
# reprojection "can this product be reprojected?" production code, without its
# error path:
#
#     reprojectable = [g for g in source_cdm.spatial_groups if g.is_raster_reprojectable]
#     for group in reprojectable:
#         handler = reprojection_precheck_handlers.get(group)
#         if handler is not None:
#             handler(group, target, ds)
#
# One handler is registered per (kind, subkind), so supporting a new layout means
# writing its handler rather than editing the reprojection plugin. A point group's
# handler is what rejects a dataset that is only points; beside a raster group, the
# points travel through the reprojection unchanged.

print("spatial_filter found latitude on our swath:",
      spatial_filter._cdm_lat_name(ds.cdm.spatial_groups[0]))
spatial_filter found latitude on our swath: latitude
The same thing, on a real granule
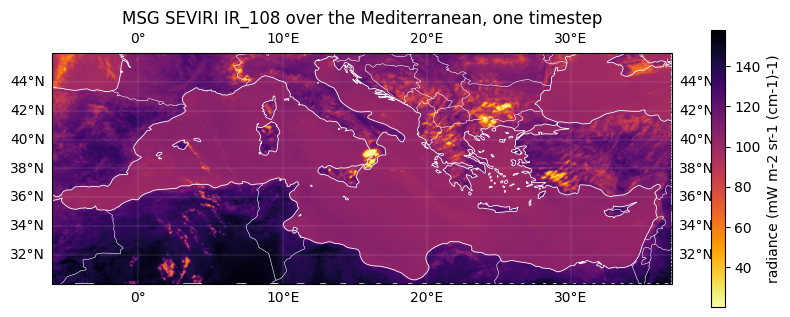
Nothing above was specific to the fictional reader. Here is an MSG SEVIRI granule read from object storage, put through the same two transformations, with the dispatch key changing from geostationary to geographic exactly as it did for the synthetic swath.
The reprojection prints one warning: the grid-mapping variable
geostationary that rides along with the channel describes the source
projection, so there is nothing in it to resample and the reprojection
skips it. The pipeline tutorial keeps it for the same reason: a content
filter puts back the grid mapping of every variable it keeps, so it
cannot drop one.
# The public Data Lake demo bucket, which needs no credentials.
S3_URI = "s3://datalake-demo-data/defair-notebook-data/msg-seviri-l15/MSG3-SEVI-MSG15-0100-NA-20260626111243.441000000Z-NA.nat"
PUBLIC_S3 = {"endpoint_url": "https://s3.central.data.destination-earth.eu", "anon": True}

msg = Dataset.from_source(
    S3_URI, reader="msg15nat", source="s3", source_kwargs=PUBLIC_S3,
    use_channel_names=True, channels=["IR_108"],
)
print("loaded       :", dict(msg.data.sizes))
print("dispatch_key :", msg.cdm.spatial_groups[0].dispatch_key)
loaded       : {'time': 1, 'y': 3712, 'x': 3712, 'bnds': 2}
dispatch_key : ('gridded', 'geostationary')
# Same two transformations. The reader didn't change; the plugins didn't change.
msg_med = spatial_filter.transform(msg, lat_min=30, lat_max=46, lon_min=-6, lon_max=37)
msg_geo = reprojection.transform(msg_med, target="EPSG:4326", resolution=0.05, resampling="bilinear")
print("filtered  :", dict(msg_med.data.sizes), "  key:", msg_med.cdm.spatial_groups[0].dispatch_key)
print("reproject :", dict(msg_geo.data.sizes), "  key:", msg_geo.cdm.spatial_groups[0].dispatch_key)
filtered  : {'time': 1, 'y': 441, 'x': 1236, 'bnds': 2}   key: ('gridded', 'geostationary')
reproject : {'time': 1, 'lon': 860, 'lat': 320, 'bnds': 2}   key: ('gridded', 'geographic')
import matplotlib.pyplot as plt
try:
    import cartopy.crs as ccrs
    import cartopy.feature as cfeature
    HAS_CARTOPY = True
except ImportError:
    HAS_CARTOPY = False

ir = msg_geo.data["IR_108"].squeeze().compute()

fig, ax = plt.subplots(figsize=(10, 4.5),
                       subplot_kw={"projection": ccrs.PlateCarree()} if HAS_CARTOPY else {})
# imshow wants the outer edges of the corner cells; the coordinates give their centres.
half_lon = abs(float(ir.lon[1] - ir.lon[0])) / 2
half_lat = abs(float(ir.lat[1] - ir.lat[0])) / 2
img = ax.imshow(
    ir,
    extent=[float(ir.lon.min()) - half_lon, float(ir.lon.max()) + half_lon,
            float(ir.lat.min()) - half_lat, float(ir.lat.max()) + half_lat],
    origin="upper", cmap="inferno_r",
    transform=ccrs.PlateCarree() if HAS_CARTOPY else None,
)
if HAS_CARTOPY:
    ax.coastlines(color="white", linewidth=0.6)
    ax.add_feature(cfeature.BORDERS, edgecolor="white", linewidth=0.4)
    ax.gridlines(draw_labels=True, color="white", linewidth=0.2, alpha=0.5)
ax.set_title("MSG SEVIRI IR_108 over the Mediterranean, one timestep")
units = ir.attrs.get("units", "")
fig.colorbar(img, ax=ax, shrink=0.8, label=f"radiance ({units})" if units else "radiance")
plt.show()

close_dask_client()
What to do next
For end-to-end guidance on writing a reader, see Write a reader plugin. The reprojection tutorial shows what the transformations do with the model once it is filled in.